
During the depths of the 2008-2009 recession, many commentators asked whether the US would turn into “another Japan”, where stock prices languished for the better part of two decades after they peaked at the end of 1989. In contrast, the US economy and equity market recovered much more quickly. We evaluate the reasons why the US outcome was so different and draw some conclusions about how these reasons affect our strategy decisions.
The Post-Crash Experience: A Tale of Two Countries
During and immediately after the latest financial crisis (circa 2008), there was much discussion of the dire state of the global economy and the global financial system. When looking at the US, in particular, many people were making the comparison to Japan in the late 1980s. In this article, we will review the Japanese and US experiences to answer several questions. Looking back 8 or 9 years, what were the differences between the post-crisis US experience and Japan’s experience in its post-1989 crash? Specifically, how did the post-crash actions in the US and Japan differ, and why did those differences result in a better economic and equity market environment in the US?
Japan
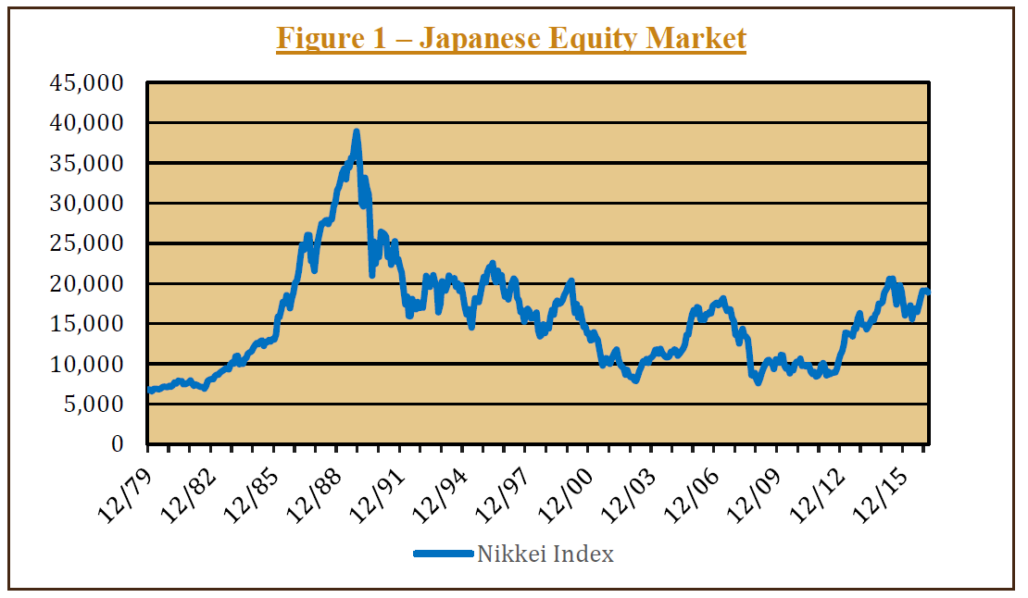
In the 10 years preceding the equity market peak on December 31, 1989, the Nikkei index rose from 6,570 to over 38,900. This nearly 6-fold increase represented an annualized gain, excluding dividends, of approximately 19.5% (so the total return to owning Japanese equities was even greater, once dividends are included). Figure 1 shows the rapid increase in the Nikkei index. Toward the end of the 1980s, the equity market doubled in less than three years, leading many commentators to look for reasons why it was “different this time.”
Instead of questioning whether the stock market’s valuation had become too lofty, many articles were written that claimed the Japanese business model and management approach were superior, and would lead to continued growth of Japanese companies at the expense of their foreign competition. The Japanese system of keiretsu was widely admired; it involved interlocking shareholdings and relationships among companies, typically centered on a large bank to provide financing and advice. In conjunction with lifetime employment, keiretsu was seen as providing the opportunity for company executives to engage in long-range planning while avoiding a short-term focus to satisfy investors. Cross-shareholdings in the late 1980s exceeded one-third of Japan’s equity market capitalization. The result was that stock price increases became self-fulfilling – a gain in one company’s share price led to rising asset values in its related party holders, which then led to more of the same.
“One of the biggest drivers of performance is the price at which an asset is purchased.”
There were also other reasons for optimism in Japan in the 1980s. The economy was strong, partially due to high rates of savings and investment which drove productivity improvements. This economic strength resulted in earnings that rose by 2.5 times in the 10 years to the end of 1989 (an annual rate of almost 9.5%).
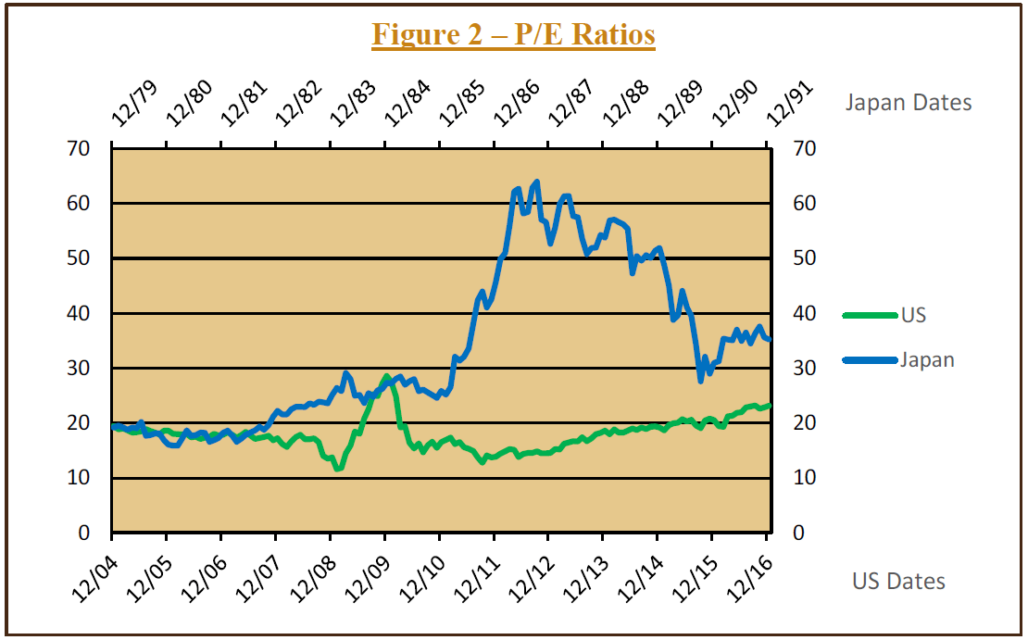
However, optimism and expectations ran far ahead of reality. By the end of 1987, the P/E ratio had risen to 60, which meant that investors were paying 60 yen for each yen of earnings, and they were receiving an earnings “yield” of less than 1.7%. (Figure 2) Over the following two years, leading up to the end of 1989, earnings caught up a bit, but the P/E ratio just prior to the market decline was still hovering around 50.
Reality started to sink in as the 1990s began. At the very start of 1990, the Japanese equity market began its sustained downward slide. The Nikkei index fell by over 75% from its peak at the end of 1989, and it has never come close to regaining that stratospheric level. Currently, the Nikkei index still remains at only half of its high point (Figure 1).
Several factors were potentially responsible for Japan’s weak stock market performance, of which two stand out to us. First is the hugely overoptimistic expectations, shown by the P/E of 50+. These expectations were not consistent with the subsequent collapse in earnings. Earnings peaked in 1990, and did not regain that level until 2005 – 15 years later. As mentioned above, earnings were, in part, the byproduct of the cross-shareholdings. Because of these holdings, rising stock prices offset any poor earnings from the actual business. These holdings also had the potential to reduce the effectiveness of competition; for example, a manufacturer would tend to rely on its associated companies to provide financial services or input parts rather than searching for better pricing from other, unrelated firms. In addition, lifetime employment meant that many employees were retained and even promoted on the basis of seniority rather than their effectiveness. Finally, long-range planning and consensus decision-making were not always conducive to making quick decisions and responding to rapid change in markets. When earnings weakness began, it unmasked the underlying weakness in profitability.
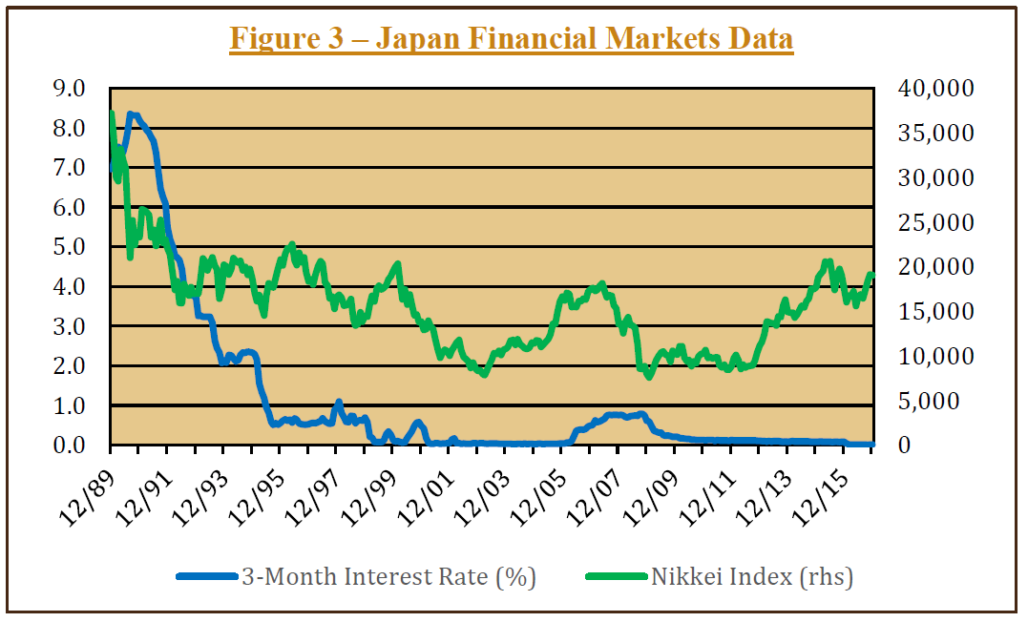
The second factor is the delayed response of the government authorities to the potential economic weakness. We can see this by examining the path of short-term interest rates, which are essentially controlled directly by the Bank of Japan (the BoJ is the Japanese version of the Federal Reserve). In Figure 3, we see that interest rates kept rising for most of 1990. In fact, they did not fall below their late-1989 level until toward the end of 1991. So, for several years the BoJ did not seem particularly worried about economic and financial markets weakness, likely because real economic activity at the time was not noticeably depressed. Short-term interest rates did not fall below 1.0% until the middle of 1995 – more than five years after the equity market peak.
“The timely actions of the Fed stood in sharp contrast to the slower and delayed response of the Bank of Japan.”
United States
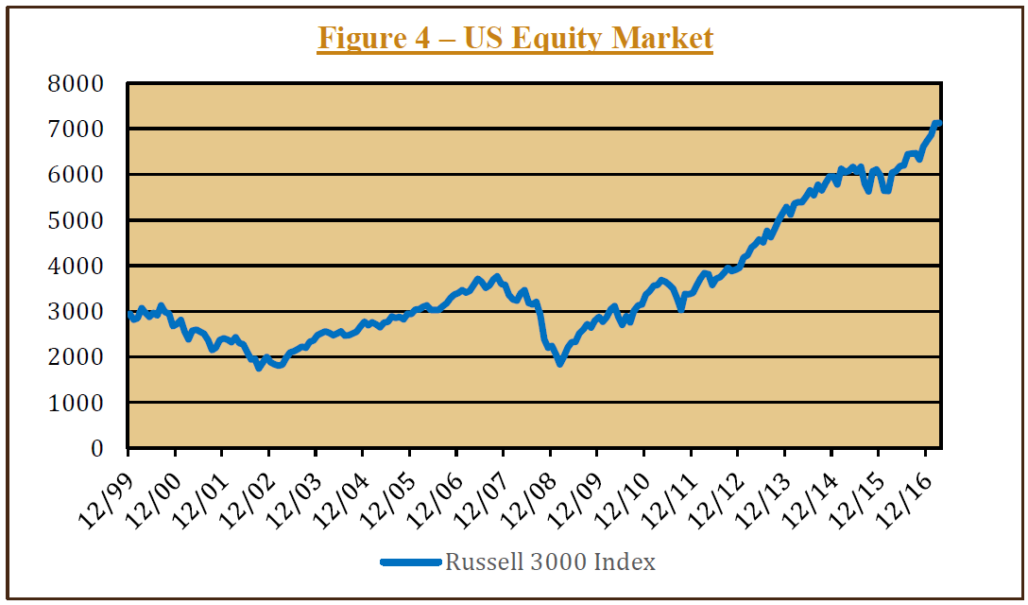
The US experience following the financial crisis of 2008 contrasts sharply with Japan. Although the stock market (measured with the Russell 3000 Index) fell by approximately 50% during 2008 and early 2009 from its peak in 2007, the previous highs were regained in early 2011. In fact, the index has tripled from its low point a decade ago (Figure 4). What might be behind this vastly different performance – performance that is completely at odds with the many articles during the crisis that were raising concerns of “another Japan”? We can highlight a few differences that help explain why the US came out of its crisis in much better shape.
First, going into the housing crash and stock market drop, the valuation of the stock market was not at the astronomical level seen in Japan. In fact, the P/E on the Russell 3000 index was below 20, as seen in Figure 2. (It is interesting to note that this P/E was also well below the 30-40 P/E during the tech bubble at the end of 1999.) A more rational valuation at the outset meant that there was less “froth” to eliminate as markets repriced.
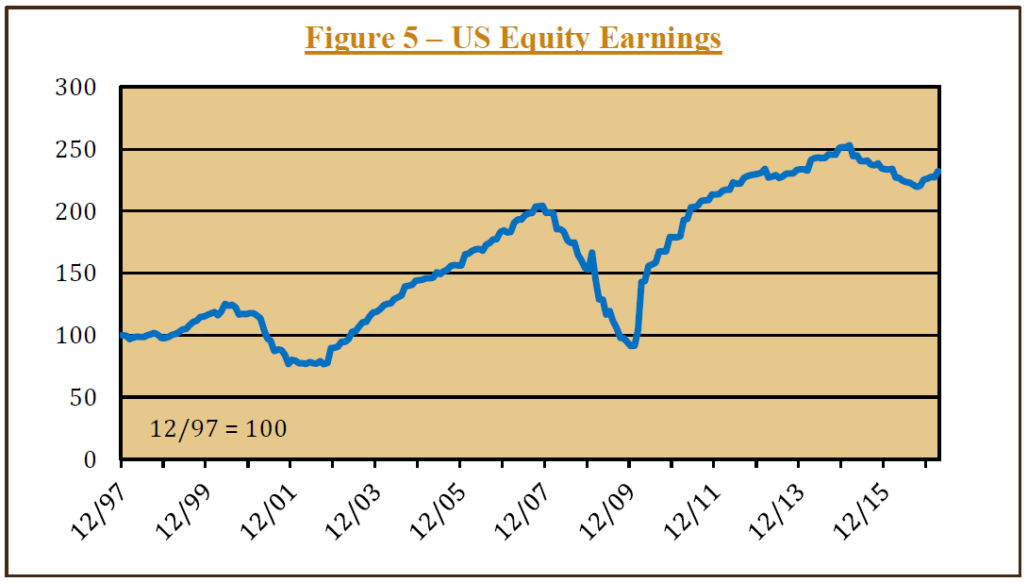
Second, earnings in the US were not headed for a multi-decade slump as in Japan. Although earnings had dropped in late 2007 by nearly 60% from the high point, Figure 5 shows that by the end of 2011 they surpassed the earlier peak and have remained high. Despite the gloom, as investors began to anticipate an earnings recovery, they clearly would have reversed their negative assessment of the stock market.
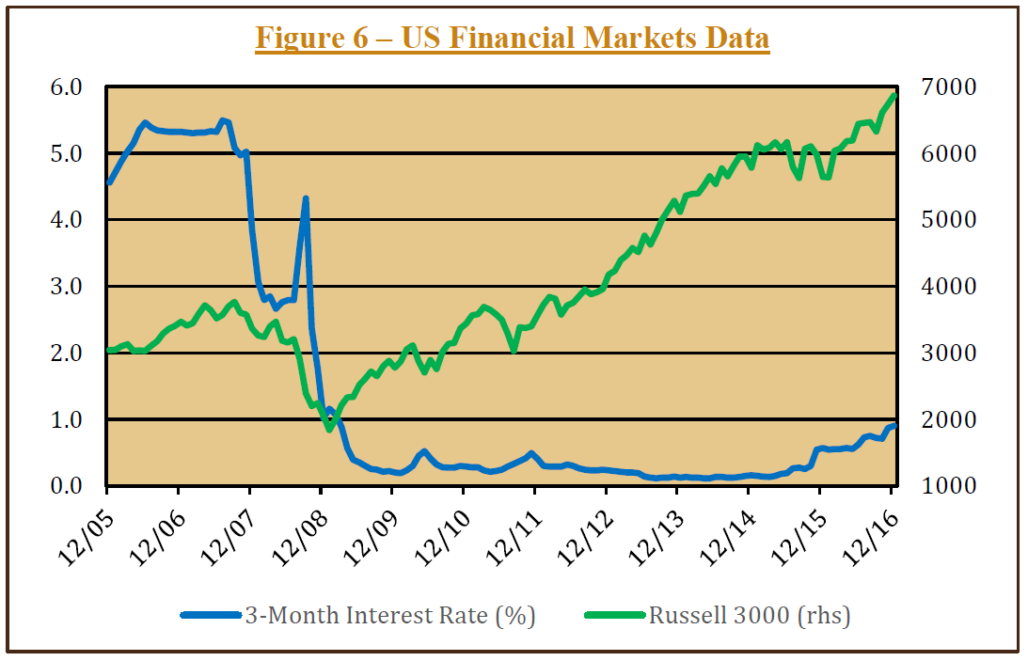
Finally, the Federal Reserve engaged in a large and rapid response to the perceived threats to financial and economic stability in the US. Not only did the Fed reduce short-term interest rates to unprecedented lows (essentially zero), they greatly expanded their balance sheet by purchasing a much broader array of securities, such as mortgage-backed bonds, and by purchasing much greater quantities than they had ever done. Whereas the BoJ took several years to reduce interest rates to nearly zero (Figure 3), in the US the time frame to get to a zero interest rate was only a matter of months (Figure 6). In their public statements and their actions, the Fed made clear that they were willing and able to do whatever it took to ensure that the financial system would not be allowed to implode.
Conclusion
What might be learned from the large difference between the Japanese experience and the US experience? We believe that this disparity highlights several important points to remember when assessing financial markets and formulating investment strategy. One of the biggest drivers of performance is the price at which an asset is purchased. Investors who purchased Japanese equities at the end of the 1980s were paying inflated prices. Buying at these prices almost guaranteed that the investors would have difficulty earning a decent return on their invested capital. This is a perfect example of typical investor behavior – buying high and selling low – which is exactly the opposite of what we all know we are supposed to do. It is understandable though, as it is always easier psychologically to buy when prices are going up and optimism reigns than it is to buy when the world seems to be falling apart and asset prices are crashing.
A second important lesson is that underlying fundamentals will, ultimately, drive asset prices. Because earnings were unsustainably high and were about to embark on a decades long slump, Japanese stock prices did not have true economic support. In contrast, because the trough in US equity earnings was temporary, stock prices had underlying fundamental support for a recovery.
Finally, the timely actions of the Fed stood in sharp contrast to the slower and delayed response of the Bank of Japan in providing the liquidity that mitigated some of the financial dislocations. This points to the potential for government to have a substantial impact on financial markets – either positive or negative. This factor can be particularly difficult to evaluate, due to the uncertainty around understanding the effects of government actions.
Stairway Partners, LLC © 2020
This material is based upon information that we believe to be reliable, but no representation is being made that it is accurate or complete, and it should not be relied upon as such. This material is based upon our assumptions, opinions and estimates as of the date the material was prepared. Changes to assumptions, opinions and estimates are subject to change without notice. Past performance is not indicative of future results, and no representation is being made that any returns indicated will be achieved. This material has been prepared for information purposes and does not constitute investment advice. This material does not take into account particular investment objectives or financial situations. Strategies and financial instruments described in this material may not be suitable for all investors. Readers should not act upon the information without seeking professional advice. This material is not a recommendation or an offer or solicitation for the purchase or sale of any security or other financial instrument.

You must be logged in to post a comment.