Since 2004, many endowments have reduced their holdings of publicly traded equity and fixed income assets. In this report, we show that they could have done as well or better with a balanced portfolio of traditional investments.
Introduction
Yale University’s David Swensen was a pioneer in endowment management, especially in the use of alternative investments. Given the investment success of Swensen’s leadership at the Yale endowment, many other college and university endowments subsequently adopted the “Yale model” of investing. However, whereas Yale’s long-term performance has been outstanding, many others have had mediocre results at best.
In this report, we show that many endowments would have done just as well or even better if they had instead stuck with a balanced portfolio of traditional traded assets. Returns would have been at least as good, and these funds would have enjoyed much higher liquidity, greater transparency, and lower fees.
Looking at the Past
Each year, the National Association of College and University Business Officers (NACUBO) publishes statistics on university endowments. These statistics include financial information such as asset allocation, overall returns, and breakdowns by size of fund.
Asset Allocation
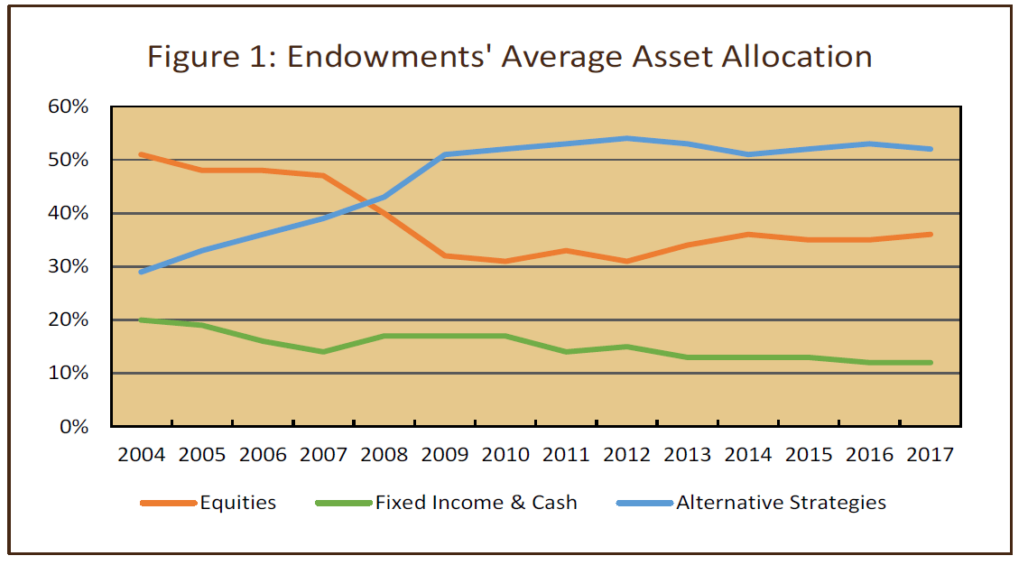
Figure 1 shows that since 2004 the average endowment’s holdings of fixed income assets have declined by nearly half – from around 20% of the total to a little more than 10%. The allocation to liquid traded equities also fell – from around 50% of assets in 2004 to around 30% in 2009-2012 – although some of that has been reversed as equity markets had a mostly unbroken string of good results coming out of the Great Recession.

As allocations to stocks and bonds were being reduced, endowment executives shifted money into alternative investments (broadly defined). For nearly a decade, the average endowment has held around half of its money in alternatives, up from 30% in 2004.
“For nearly a decade, the average endowment has held around half of its money in alternatives”
Returns
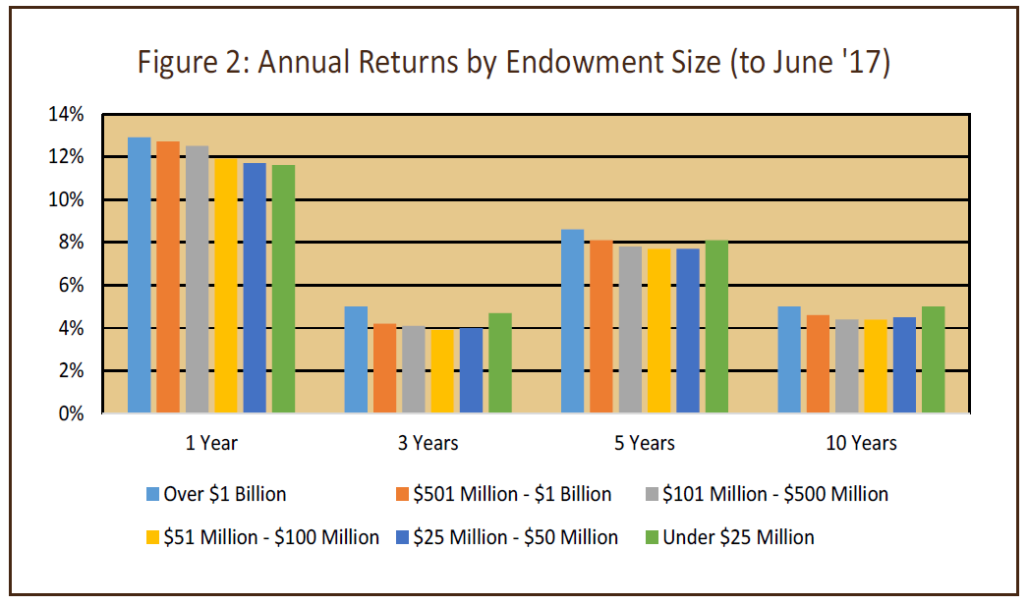
Looking back, the size of an endowment has influenced its return. Figure 2 shows that, over time, the largest endowments (greater than $1 billion in assets) have outperformed other (smaller) endowments. This is fairly typical, because the largest endowments tend to have much greater access to the best-performing managers, especially in the alternatives space. The largest funds can also negotiate lower management fees due to their ability to commit larger amounts of capital to asset managers. These factors most likely provide a material advantage to larger funds as they invest in alternative assets.

There has been a difference of 60 bps between the largest endowments’ average annual return of 5.0% and the smaller endowments’ return of 4.4% over the last decade. Although the outperformance in Figure 2 might not look like much, an annual difference of 60 bps cumulates over 10 years to a fairly sizeable amount – a 63% total return vs. 54%.
Investment Observations
In theory, alternatives are ideal for endowments. Their long-term horizon means that maintaining a high degree of liquidity is not usually a concern. As a result, substantial allocations can be made to private equity, venture capital, natural resources (such as timber), and hedge funds (which oftentimes have long lock-up periods). Likewise, active management does not present the sorts of realized capital gains tax drag that can consume the returns earned by taxable investors. On the traded-asset side, endowments can hold taxable bonds for the income. In fact, riskier bonds that carry high interest rates (e.g. high yield and emerging markets debt) can be quite attractive.
Many endowments, seeing the excellent results produced by Yale under Swensen’s leadership, made a big push into alternatives under the belief that they would enjoy those same returns by allocating to the same asset classes. There was also the anticipation that alternatives would have the added benefit of low correlation to their traded-asset portfolio.
“Endowments’ allocations to alternatives did not provide the large benefits that were anticipated”
An additional impetus to shifting assets into alternatives may have been the widespread belief, for many years, that forward-looking returns in public markets were likely to be low. This view was supported by record-low bond yields and by “high” stock market pricing (when viewed through measures such as the P/E ratio). As a result, alternatives were seen as offering better return prospects than conventional equity and bond investments.
Unfortunately, many endowments found that alternative investments did not work out as well as expected and hoped for. Many endowment funds were disappointed in the performance of their alternatives (in particular, hedge funds). What they failed to appreciate was the importance of being one of the early investors and of having access to the best managers, rather than simply putting money into an asset class.
A Simple Comparison
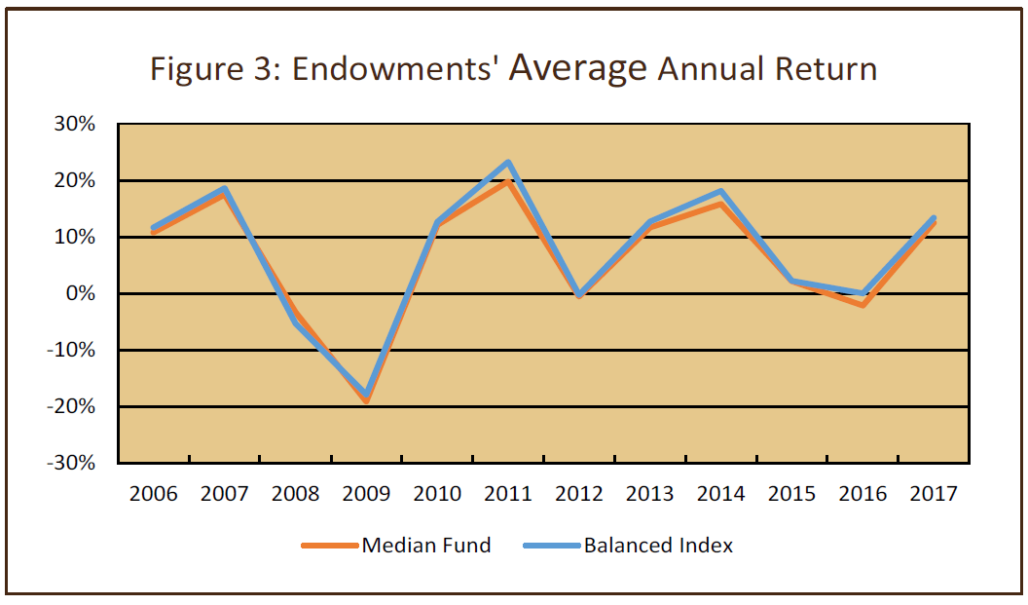
Figure 3 shows the yearly returns to the median endowment and to a simple balanced benchmark index, consisting of 70% equities (split 60% US and 40% non-US developed and emerging) and 30% investment-grade US bonds. This index has a much larger allocation to bonds than the typical endowment does (Figure 1), and in place of alternative investments it holds greater positions in equities and bonds. We can see from Figure 3 that the returns on the balanced index mirror the returns to the median endowment. However, the average return on the balanced index over the full period shown exceeds the median endowment’s return by around 90 bps annually. As mentioned above, this “small” gap compounds to a fairly large outperformance gap over a long period of time. Note that the return on the balanced index does not include any expenses that would be associated with actually investing in these assets. So, even for an entirely passive investor, the index returns would need to be reduced by any costs associated with the investment vehicles, management of the portfolio, and rebalancing transactions. For passive investments, the 90 bps performance gap would be reduced, perhaps by 20-25 bps annually.

One possible conclusion to be taken from the returns in Figure 3 is that endowments’ allocations to alternatives did not provide the large benefits that were anticipated. For alternatives to be worthwhile, investors need access to the top managers. Otherwise, they are better off investing in liquid marketable assets, not only from a liquidity perspective but also from a return perspective. There are several reasons for this:
- First, the median alternatives manager has a hard time beating publicly traded equities, and the dispersion of results across managers can be enormous, so the costs of getting it wrong are large.
- Second, the costs of researching managers are high. These costs include consultant fees for manager selection, and internal due diligence costs for the endowment. These costs are not always included in reported returns.
- Third, the true underlying risks of many alternatives are higher than published. This is primarily a function of the appraisal nature of some alternative investments – such as real estate, private companies, etc. – which leads to smoothing of returns and therefore understated risk.
A Fully-Liquid Approach
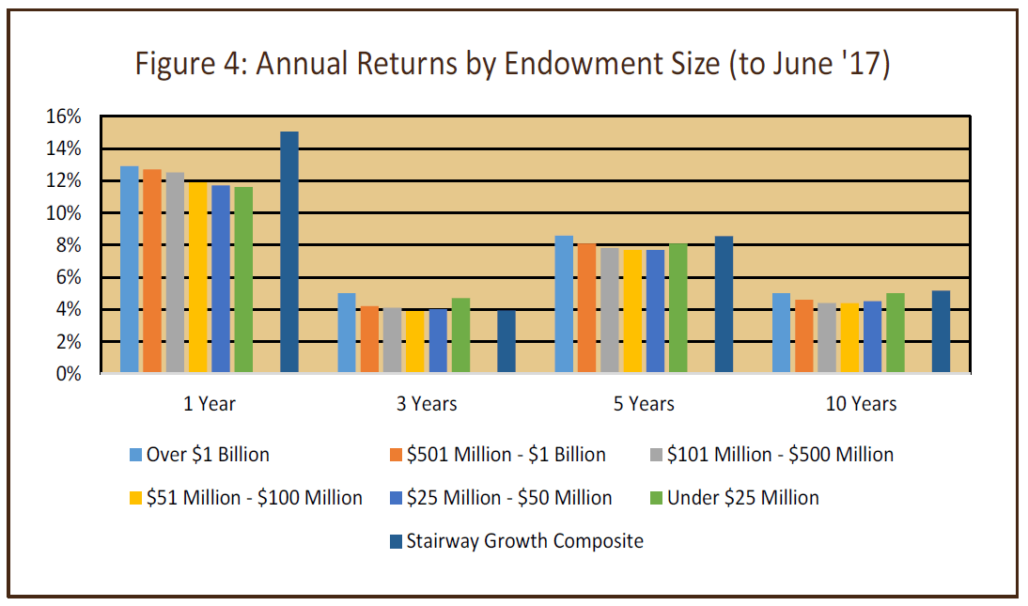
In Figure 4, we repeat the information in Figure 2 showing returns arranged by endowment size. However, in Figure 4, we have added the performance of the Stairway Partners’ Growth Composite. We have adjusted the composite’s gross-of-fee returns to reflect a Stairway management fee of 35 bps, which is equivalent to the fee charged on a portfolio of $75 million.

The portfolios that make up this composite have an average (benchmark) equity exposure of approximately 70%, so the stock-bond mix is comparable to the balanced index shown in Figure 3. Note that the composite’s returns are net of all fees and expenses, including Stairway management fees, transaction costs, and all underlying investment expenses.
Conclusion
It is evident that a portfolio of conventional liquid stock and bond investments has performed as well as, or better than, the portfolios of many endowments. Given the fact that endowments have spent many years trimming their traded-asset holdings in favor of illiquid alternatives, it would seem that this trend has not accomplished much. In fact, it appears likely to have provided no benefit or even to have been a negative.
Although they have long time horizons and can afford to hold illiquid investments, endowments gave up liquidity and received seemingly little in return. Despite the fact that endowments can afford to hold illiquid investments, they probably do not want to hold underperforming investments.
The lack of liquidity is not the only issue for alternative investments. They also tend to have considerably higher fees and expenses than conventional liquid assets. In addition to the expenses directly attributable to alternatives, there is another layer of substantial costs that the endowment sponsor bears: the expenses related to hiring professionals in legal, accounting, and investment evaluation and monitoring. These typically are much higher for alternative investments than they are for traditional investments. This is yet more evidence that the substantial tidal flow of money into alternatives was costly and of little benefit.
Although endowments have held relatively small amounts of fixed income (which is also consistent with a long time horizon and high ability to take risk), the performance over time of the assets that have replaced those bonds has not been remarkable. For many or most endowments, overall performance has not even exceeded the performance of a balanced portfolio of liquid assets.
Finally, endowments are subject to the same biases that individual investors display. They exhibit the behaviors that individuals do – buying what has been “hot” and selling what has performed poorly. We can see a great example of this in their rush to adopt the Yale model, since it did so well for David Swensen and Yale’s endowment. Ultimately, the outcome that results from this “buy high/sell low” activity is poorer returns than would have been earned by taking a more measured approach to asset allocation.
Stairway Partners, LLC © 2020
This material is based upon information that we believe to be reliable, but no representation is being made that it is accurate or complete, and it should not be relied upon as such. This material is based upon our assumptions, opinions and estimates as of the date the material was prepared. Changes to assumptions, opinions and estimates are subject to change without notice. Past performance is not indicative of future results, and no representation is being made that any returns indicated will be achieved. This material has been prepared for information purposes and does not constitute investment advice. This material does not take into account particular investment objectives or financial situations. Strategies and financial instruments described in this material may not be suitable for all investors. Readers should not act upon the information without seeking professional advice. This material is not a recommendation or an offer or solicitation for the purchase or sale of any security or other financial instrument.


You must be logged in to post a comment.